Geospatial Building Growth Analysis
Urban growth mapping using Google Open Buildings and H3 hex grids.
🛰️ Geospatial Building Growth Analysis
A modular pipeline for extracting, analyzing, and visualizing urban growth patterns from satellite data.
Focus: Metropolitan Area of San Salvador (AMSS), El Salvador.
🚀 What does it do?
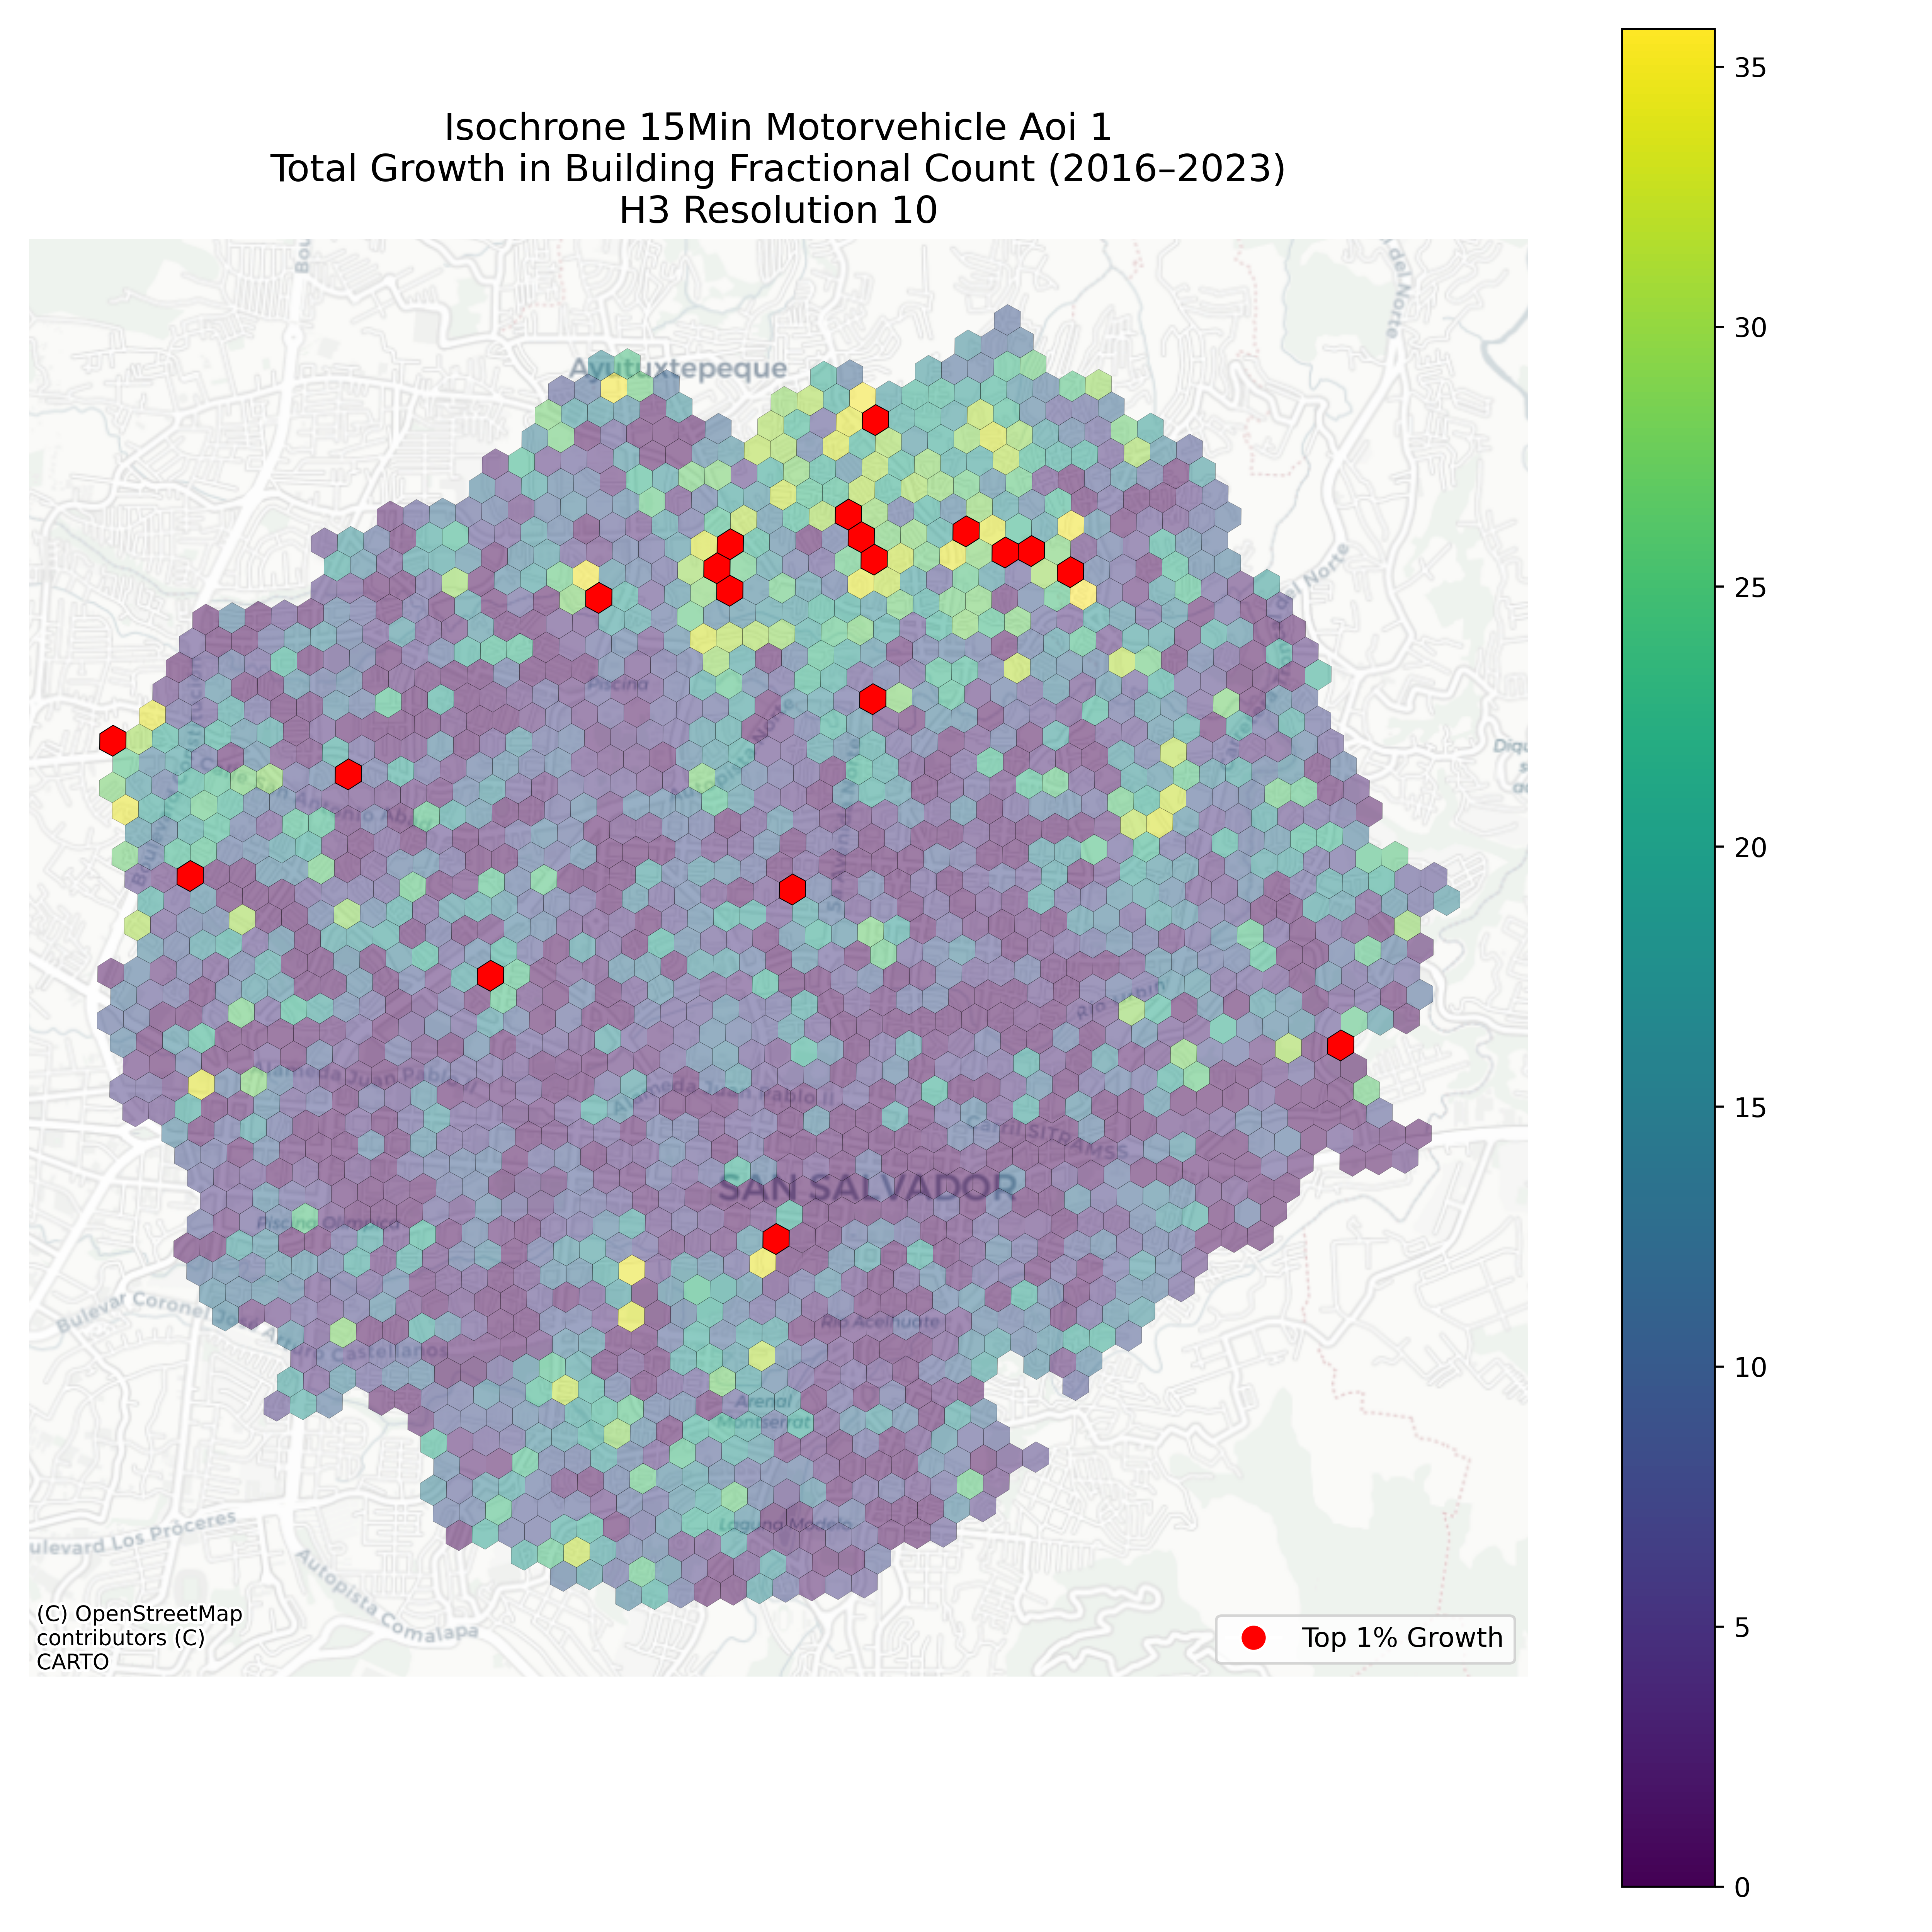
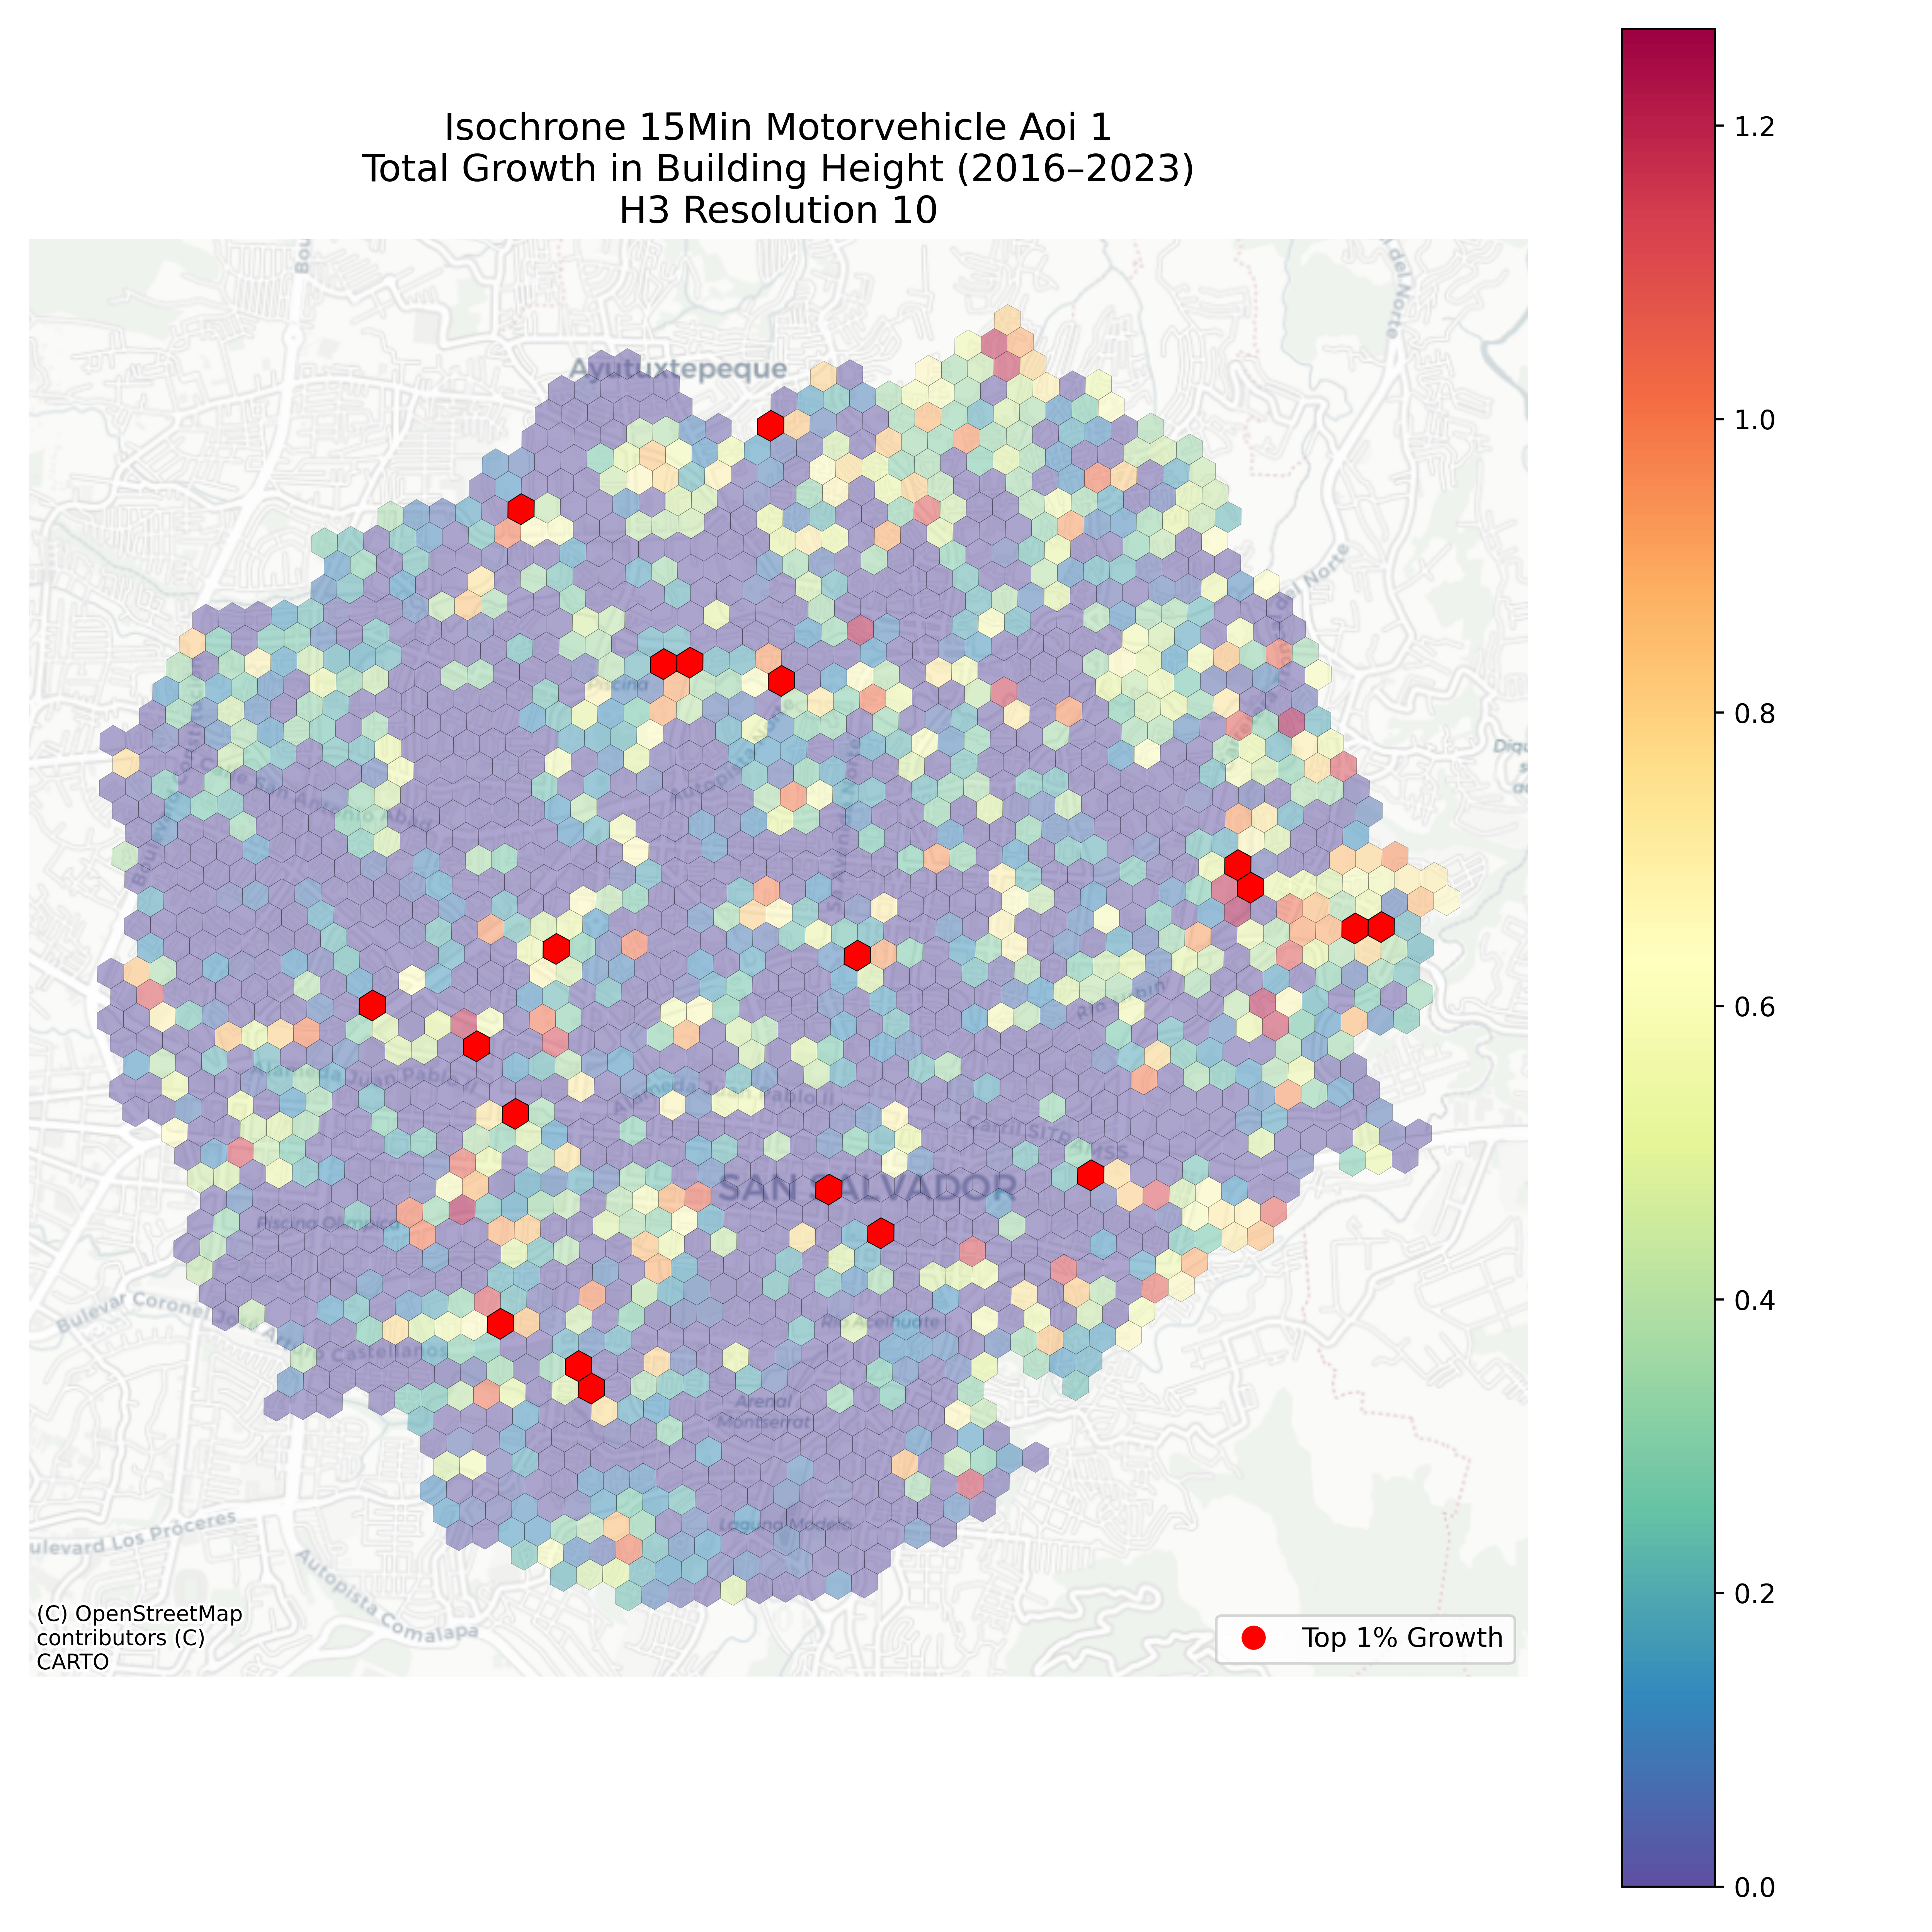
- Maps year-on-year building growth (counts, area, and height) using the Google Open Buildings Temporal Dataset.
- Uses H3 hexagonal grids for high-res spatial analysis (~100m).
- Fully automated workflow: feature extraction, growth computation, and mapping.


Left: Building counts per H3 hex (2023).
Middle: Mean building heights across the city (2023).
Right: Animated top 1% growth cells from 2016 to 2023.
Middle: Mean building heights across the city (2023).
Right: Animated top 1% growth cells from 2016 to 2023.
🔍 Key Features
- Automated H3 grid generation over any AOI.
- Batch feature extraction from Earth Engine (building count, area, height).
- Year-on-year growth metrics per municipality and hex cell.
- Customizable workflow: skip/re-run any step, override config via CLI.
- High-res maps and animations for easy visualization.
💡 How does it work?
The workflow consists of modular Python scripts:
- AOI and grid setup
- Feature extraction via Google Earth Engine
- Growth computation
- Visualization (static and animated)
All driven by a master script for reproducibility.
📊 Outputs
- Geopackages of extracted features and growth metrics
- Publication-ready plots and GIFs
- Easily extendable to any region covered by Open Buildings
🛠️ Technologies
- Python (geopandas, h3, matplotlib, etc.)
- Google Earth Engine API
- H3 hexagonal indexing
- Streamlined CLI & config for full control
🔗 GitHub Repo
Project lead: Javier Alfaro
Made with ❤️ for open urban analytics.