🛰️ Gentrification from the Sky detects the physical signatures of gentrification (building density, rooftop materials, green space) directly from open Sentinel-2 imagery, and shows they improve gentrification prediction across 4,085 London neighbourhoods by up to 8 percentage points, reaching a balanced accuracy of ~77%(Alfaro et al., 2025).
Prize-winning LSE MSc dissertation (CDRC Master Dissertation Scheme 2024), published as a Springer book chapter and presented at CUPUM 2025.
❓ Problem
Gentrification is usually measured with census data, which is costly, slow, and spatially coarse: neighbourhood change shows up years after it happens. Satellites see the city every few days, and many of the physical changes that come with gentrification are visible from above.
🧩 How It Works
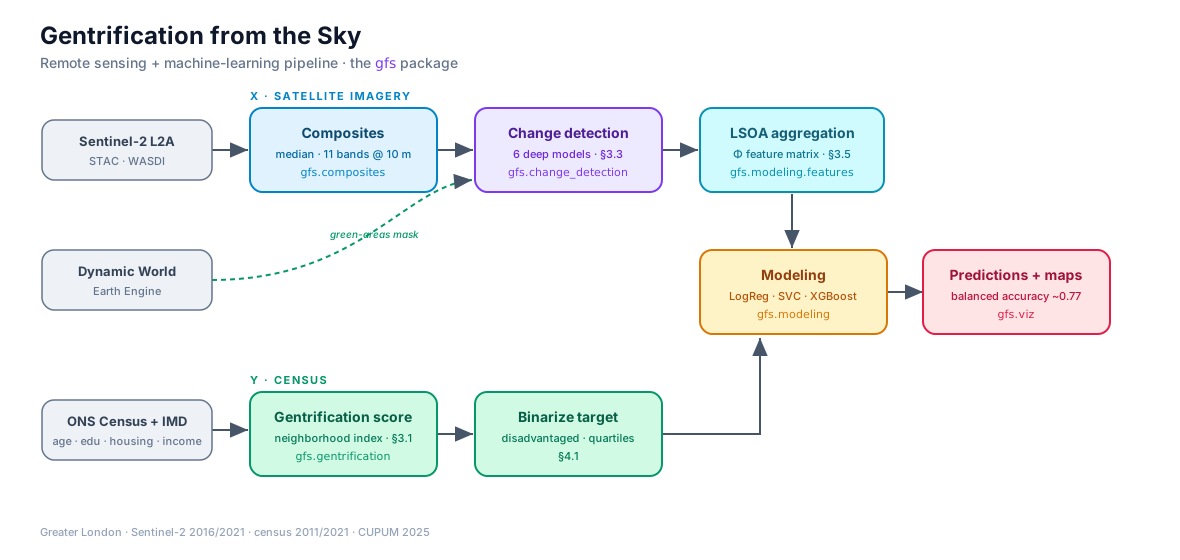
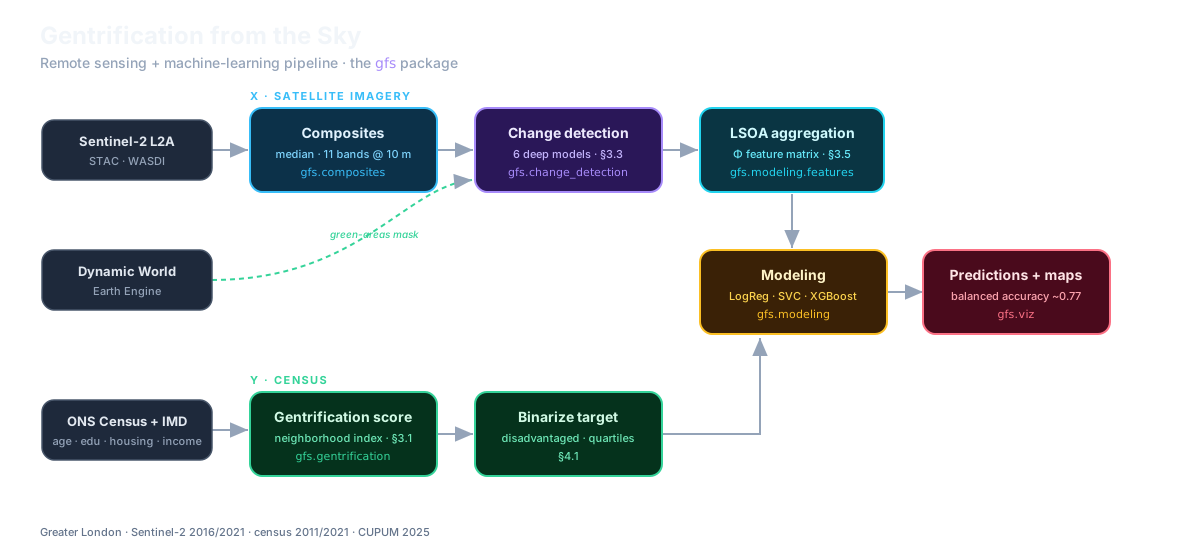
X, satellite imagery: Sentinel-2 composites for 2016 and 2021 (11 bands at 10 m), passed through deep-learning change detection, then aggregated per neighbourhood.
Y, census: a gentrification score from the 2011 and 2021 censuses and the Index of Multiple Deprivation, binarized over disadvantaged neighbourhoods.
Prediction: classifiers with and without the satellite features, so the gain from imagery is measured against a census-only baseline.
Deep feature extraction for change detection: a Siamese encoder compares the two dates at low and high feature levels, and a decoder maps where the city changed. Six architectures were compared, from simple differencing to TinyCD.
📊 Results
Table 1. Predicting gentrification with satellite features: XGBoost is best on every metric.
Model
Balanced accuracy
F1
ROC-AUC
Logistic Regression
0.743 ± 0.051
0.742 ± 0.050
0.806 ± 0.047
Linear SVC
0.743 ± 0.050
0.740 ± 0.048
0.810 ± 0.046
XGBoost
0.767 ± 0.049
0.766 ± 0.049
0.841 ± 0.043
Mean ± variation over 3 × 10-fold repeated stratified cross-validation, 4,085 London LSOAs.
Left: census gentrification score, 2011–2021. Right: adding satellite features lifts balanced accuracy for every model, from 0.68–0.69 to 0.74–0.77.
🗺️ Spatial Patterns
Left: where predictions succeeded or fell short across London. Middle: validation in Tower Hamlets — detected change against conservation areas, which are protected and should change little. Right: detected change within planning-policy layers, potential drivers of gentrification.
References
2025
Springer
Gentrification from the Sky: Using Remote Sensing and Machine Learning for Urban Change Detection
Gentrification is an urban phenomenon marked by socioeconomic shifts that can displace long-term residents and increase inequality. Accurate measurement is essential for effective urban planning and equitable development. Traditional reliance on census data is costly, slow, and lacks the spatial and temporal resolution needed to detect neighborhood-level changes in real time. This study addresses these challenges by combining open satellite imagery with machine learning techniques to quantify gentrification more effectively. By analyzing high-resolution imagery, we detect physical changes—such as shifts in building density, rooftop materials, and green spaces—that are linked to gentrification but often overlooked by census- based approaches. Using the Greater London Area as a case study, our method improves measurement accuracy by up to 8%, achieving a balanced accuracy of 77% across 4,085 neighborhoods. Even a small improvement in accuracy can enable better identification of at-risk neighborhoods, helping policymakers intervene before displacement pressures become irreversible.
@incollection{alfaro2025gent4sky,title={Gentrification from the Sky: Using Remote Sensing and Machine Learning for Urban Change Detection},author={Alfaro, Javier and Šćepanović, Sanja and Law, Stephen and Quercia, Daniele},booktitle={Digital-Era Urban Transformations},series={The Urban Book Series},publisher={Springer Nature Switzerland},pages={199--225},year={2025},doi={10.1007/978-3-031-98300-9_12},note={Presented at CUPUM 2025, London.},}